

 Disclaimer: this post is a summary of Chapter 2: My body is a temple, from my book: Machine Learning For Bearded Hipsters. You can support the project here.
We are humans who live in a society, and as part of it, we care about how others look at us. Are we good enough? Do we look great enough? Have we gained some pounds these Christmas? January is a good month to start good habits, (but the rest of the year is great to maintain them). Some of the typical habits we try to get are related to our body shape for this reason I decided to start this post about getting the perfect body shape with Machine Learning.
Keep it simple
In both my book and my posts I want to reach everybody independently of their coding skills, and as a first serious post about a Machine Learning algorithm, today I propose you to develop this exercise on an excel sheet. Later, we will learn how to code it in the typical Machine Learning languages like Python, R, Matlab, Scala, etc.
Generalizations on diet
Excepting when you visit your nutritionist, who does this work for you based on you and only you, all the information on the internet is an average, something that used to work to most of the people, but maybe not to you. But if you train your Machine Learning model on your own body, the results you will get are yours and only yours, not an average, not an orientation, they will be your exact values on how your body works.
Disclaimer: It is important that if you have some health problem your medical doctor guides you about your diet, not an algorithm since it has some error margins and even normal bodies can handle error margins, maybe your body cannot.

What do I need?
This process is a long process, first, you need to experiment with your own experience to teach the model how your body works. So the first thing you need is patience, this is a long-term process but in the end, you will understand what works for you. Other things you will need.
- A body weight scales.
- A kitchen scales.
- A measuring tape.
- Basic gym equipment or gym subscription.
- A computer running excel or any similar.
How do I start?
Start opening you excel sheet and create three different sheets, call them “General”, “Nutrition” and “Exercise”. You will use them to track during a month all your exercise routines and whatever you eat or drink as well as your weight records.
On the “Nutrition” Sheet create the following columns:
- Date. It is important since later we need to group all the inputs for the same week.
- Time. The hour of the day you are eating or drinking, it is important to see at what time of the day you are getting your calories.
- Food. Food name to identify easily what you have eaten, for example, “apple”
- Calories. Overall calories of the full dish, for example, if you have a salad, don’t count for every ingredient just identify as Salad #1 and whenever you use Salad #1 you assume you used the same ingredients, quantities and as consequence, calories.
- Carbs. As in the previous point but just taking into account carbs.
- Proteins. As in point # 4 point but just taking into account proteins.
- Fats. As in point # 4 but just taking into account fats.
- Notes. Other stuff you consider relevant.
On the “Exercise” sheet create the following columns:
- Date. It is important since later we need to group all the inputs for the same week.
- Description. What exercise you did.
- Duration. How long you were exercising.
- Calories Burned. How much calories you’ve burned.
- Notes. Other stuff you consider relevant.
Later, you must fill the entries during one full month, if not, at least try two weeks.

The Machine Learning Behind
As I told you at the beginning of this post, in this case, we will just perform over excel cells. However, if you have coding skills you can code the same procedure in any language you feel comfortable with. If not, you can pre-enroll the future course contacting me here and you will be able to code it in any of the studied versions.
In the “General” sheet we will perform some actions to track the real advance of your steps in nutrition and exercise and try to predict what steps are more helpful to your goal. This is called, multi-variable regression, but we will advance step by step.
The simplest case: the most I eat the weightiest I feel (aka linear regression with one variable)
The simple case consists in taking into account two concepts, the dependent variable (your weight) and the independent variable (what you eat) since what you weight depends on what you eat but not the opposite! And suppose they have a linear and inverse proportional behavior.
For, example, I’ve noted during one week everything I’ve eaten and the calories it contains:

Later, I group all the foods eaten during each day and the weight I register after measuring my results. Also an extra column with the weight loss.

Later, I use the dot graphics tool to study the correlation between variables. (I’ve been very addicted to this correlation game my friend Gab sent me).

Then, I compute the mean (x̄, ȳ) and standard deviation values (sx, sy) to both Calories and Weight Loss, in my case they are:
- x̄ = 1286
- ȳ = 0.4
- sx = 62.23
- sy = 0.17
Later, we have also to compute the correlation value of the data with the following formula:
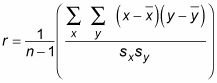
In my case r = -0.61. As you can see, it is a negative number since as we mentioned before, the behavior of the model is inversely proportional.
With the previous information, we can compute the regression line. The formula for the slope, m, of the best-fitting line is:

where r is the previously computed correlation, and sx and sy are the standard deviations of the x-values and the y-values, respectively. The last step to compute the regression line is to know where the line intercepts with the x-axes, this step is called y-intercept and is represented with a b:
![]()
In my case, my m value is -0.0017 and my b value is 2.54. I did all the calculation in excel like the following image (if you have any trouble, you can download the excel at the end of the post).

Now, you have the model predicted! And you can guess how much weight you will lose with a determined caloric input. I also used my excel sheet to write different caloric input from 1200 to 1300 calories (in 10 by 10 calories increments) and use the equation y = m*x – b to know how much weight loss corresponds to every calorie intake. Of course, the data used to train is really poor, so you can increment your data every day with the proper weight and calculate the error from the model estimation and the real measurement.

And this is the simplest case, where we only have taken into account the calorie intake, to make it more realistic we can add other variables like the Carbs, Protein, Fats, and also the amount of calorie burn in the gym or doing other exercises. All of these cases are explained in the book, machine learning for bearded hipsters, anyway, I also plan to explain some of them in the future for free, so … don’t forget to subscribe to be don’t miss them!

Now please tell me?
What are you self-care planes for 2019?
In 2018 I lost 10kg and start a living healthy before everything lifestyle, I hope in 2019 I’ll be able to keep it!.
If you found the post interesting please subscribe, comment and share it! Your interaction is crucial to make this site grow up!
>> MACHINE LEARNING FOR BEARDED HIPSTERS SERIES <<

xoxo,

After I realized that I never would be winning an Olympic gold in the 200m butterfly, I spend many years thinking about what to do in life, researching which path should I follow to accomplish my life goals that were on reach. So, it’s not surprising that after many efforts in this research I became a researcher. First a news researcher (or call it journalist if you prefer) and later a scientific researcher.
Hi, how’s it going? Just shared this post with a colleague, we had a good laugh.